Benchmarking My Own Assumptions: A 7-Agent RAG System That Got Smaller After 1,296 Runs
If more techniques reduce hallucination, stacking them should make the system more reliable.
I built a retrieval-augmented generation system around that idea. The resulting system had seven agents. HyDE and multi-query expansion improved retrieval. A reranker narrowed the context. Multiple generators produced candidate answers. A consensus stage selected an answer, followed by verification and confidence scoring.
It looked like a stronger system. I wasn't sure it was a better one. So I stopped adding components and benchmarked the architecture I had built.
View the code on GitHub ↗Problem
The system had accumulated several techniques for improving retrieval and reducing hallucination: HyDE query expansion, multi-query expansion, reranking, parallel generation, consensus, claim verification, confidence scoring. Each had a reasonable justification in isolation. The problem was that I didn't know which ones were actually earning their place in the pipeline. More components meant more LLM calls, more latency, more failure modes, and more complexity to maintain.
Which configuration gives me the best trade-off between answer quality and latency?
Hypothesis
Adding more retrieval and generation safeguards should improve answer quality enough to justify their additional cost.
- The reranker will improve quality at some latency cost.
- Three generators will produce better answers than one.
- More query variants will improve retrieval.
- Combining HyDE and multi-query will be safer than either alone.
I also had a custom grounding score I expected to provide a useful signal for measuring whether answers were supported by retrieved evidence. These were assumptions. The benchmark was designed to test them.
Experiment
I converted the architecture into a full-factorial experiment, varying three factors:
| Factor | Levels |
|---|---|
| Reranker | ON / OFF |
| Generators | 1 / 3 |
| Query expansion | HyDE / multi-query / both / off |
16 configurations, each answering the same 27 evaluation queries. The first pass ran each configuration once — 16 × 27 = 432 runs. Latency here is dominated by external LLM API calls, which are noisy by nature: network variance, provider load, and retries can all move a single measurement without the architecture changing at all. So I reran the full design three times and pooled the results: 16 × 27 × 3 = 1,296 query runs.
For the final ranking, I combined normalized latency and quality into a balanced composite score, then checked the Pareto frontier and ran a weight sweep to make sure the result wasn't caused by one arbitrary weighting choice — and this time, checked which configurations' pooled numbers I could actually trust.
View the experiment on GitHub ↗Results
The three factors I varied — reranker, generators, and query expansion — had different effects on latency and quality, and pooling three runs changed which effects were real:
1. The reranker: a lever that shrank under scrutiny
In the first pass, enabling the reranker looked like the single biggest lever in the system. Average latency fell from 16.6s to 9.2s when enabled — roughly a 45% reduction. Reranking also improved context precision and claim support without reducing faithfulness.
I didn't trust this number. A 45% latency swing from a single run is a big claim to hang an architectural decision on, especially against an external LLM API subject to ordinary network and provider variance. Before treating it as real, I reran the full design three times.
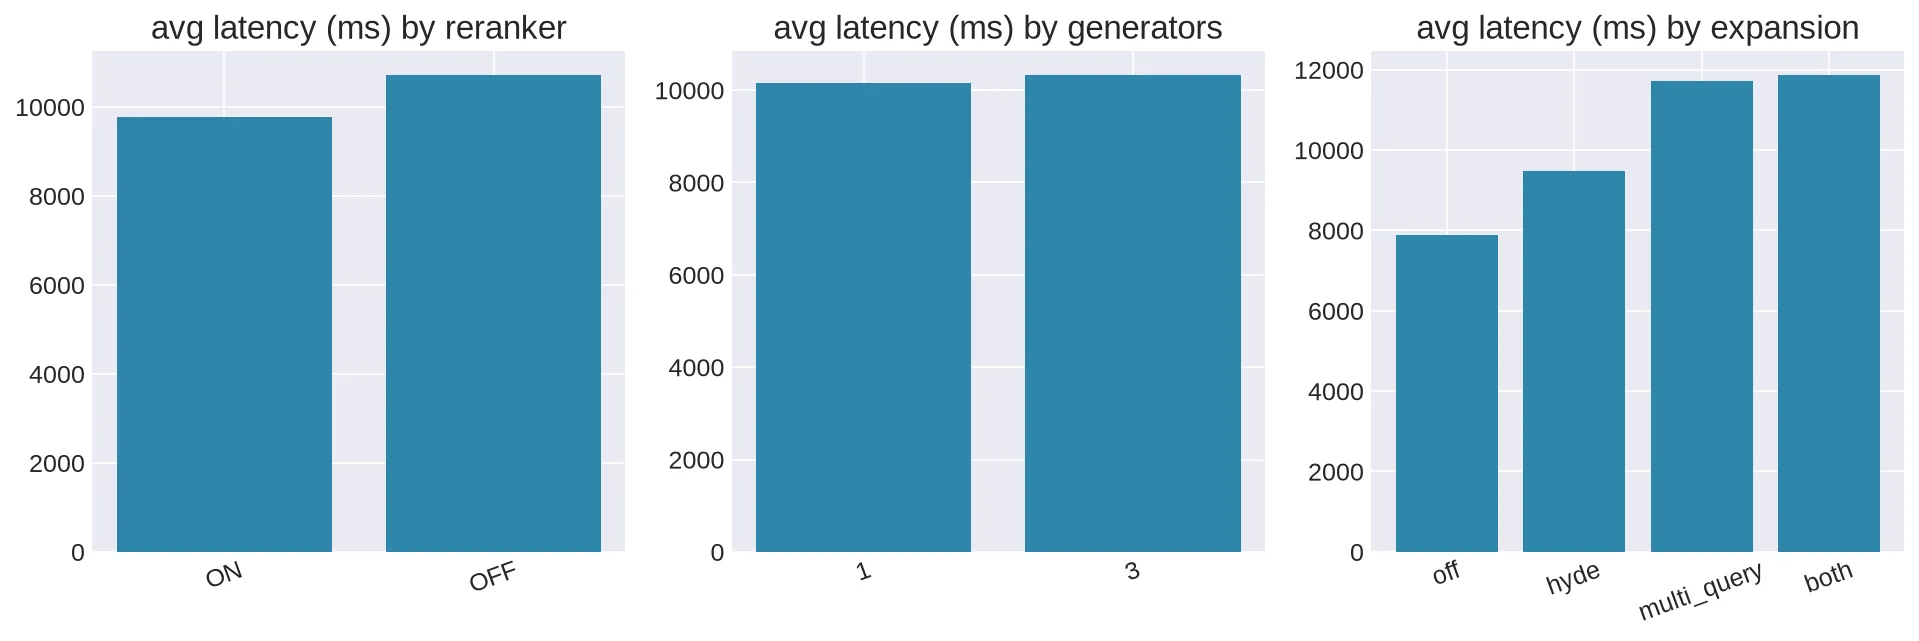
The pooled main effect was a fraction of the original: 9,765 ms with the reranker ON vs. 10,714 ms OFF — a 9% difference, not 45%. The dramatic speedup didn't reproduce.
| Reranker | Average latency (pooled) |
|---|---|
| ON | 9,765 ms |
| OFF | 10,714 ms |
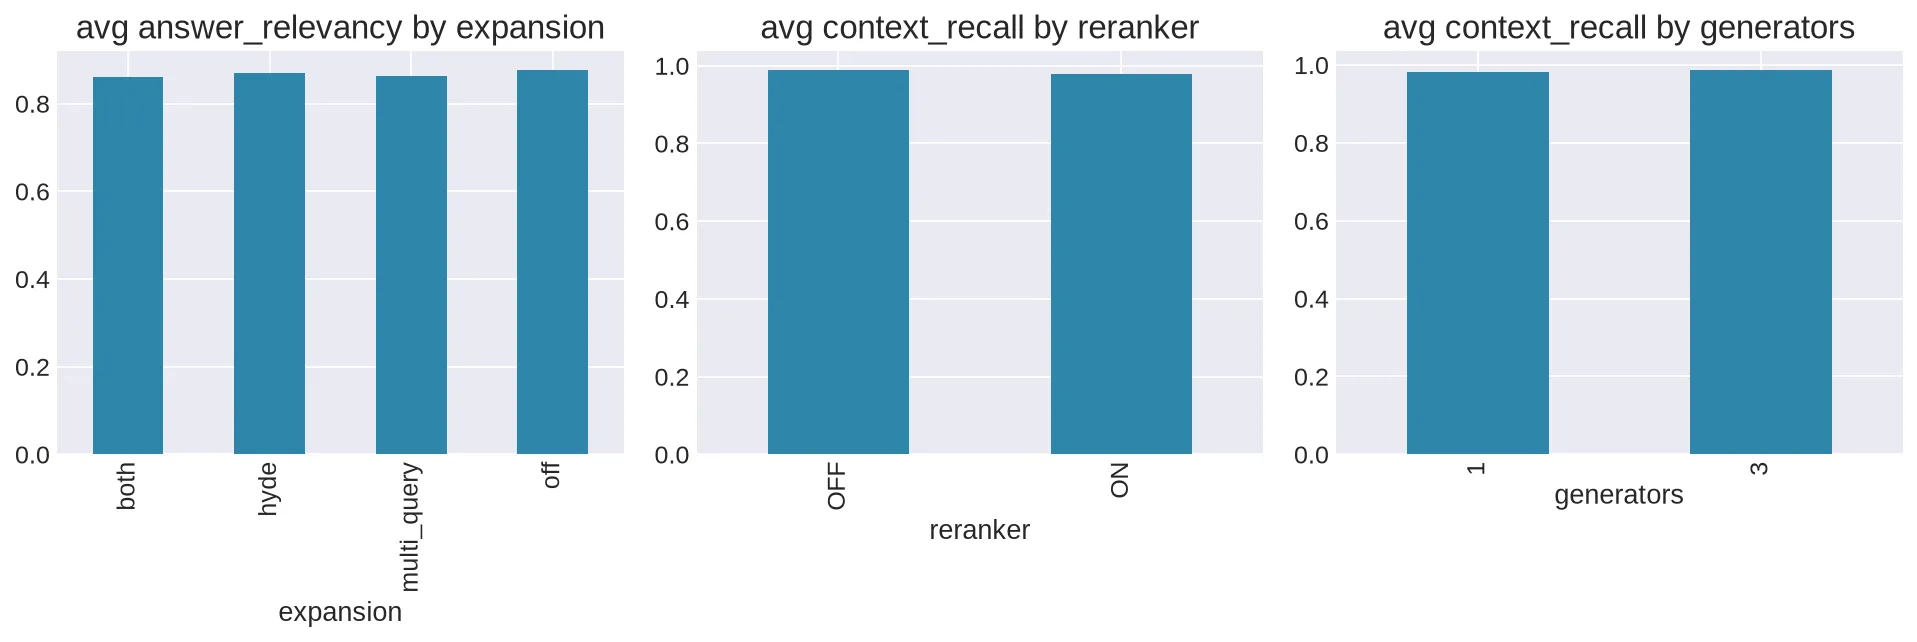
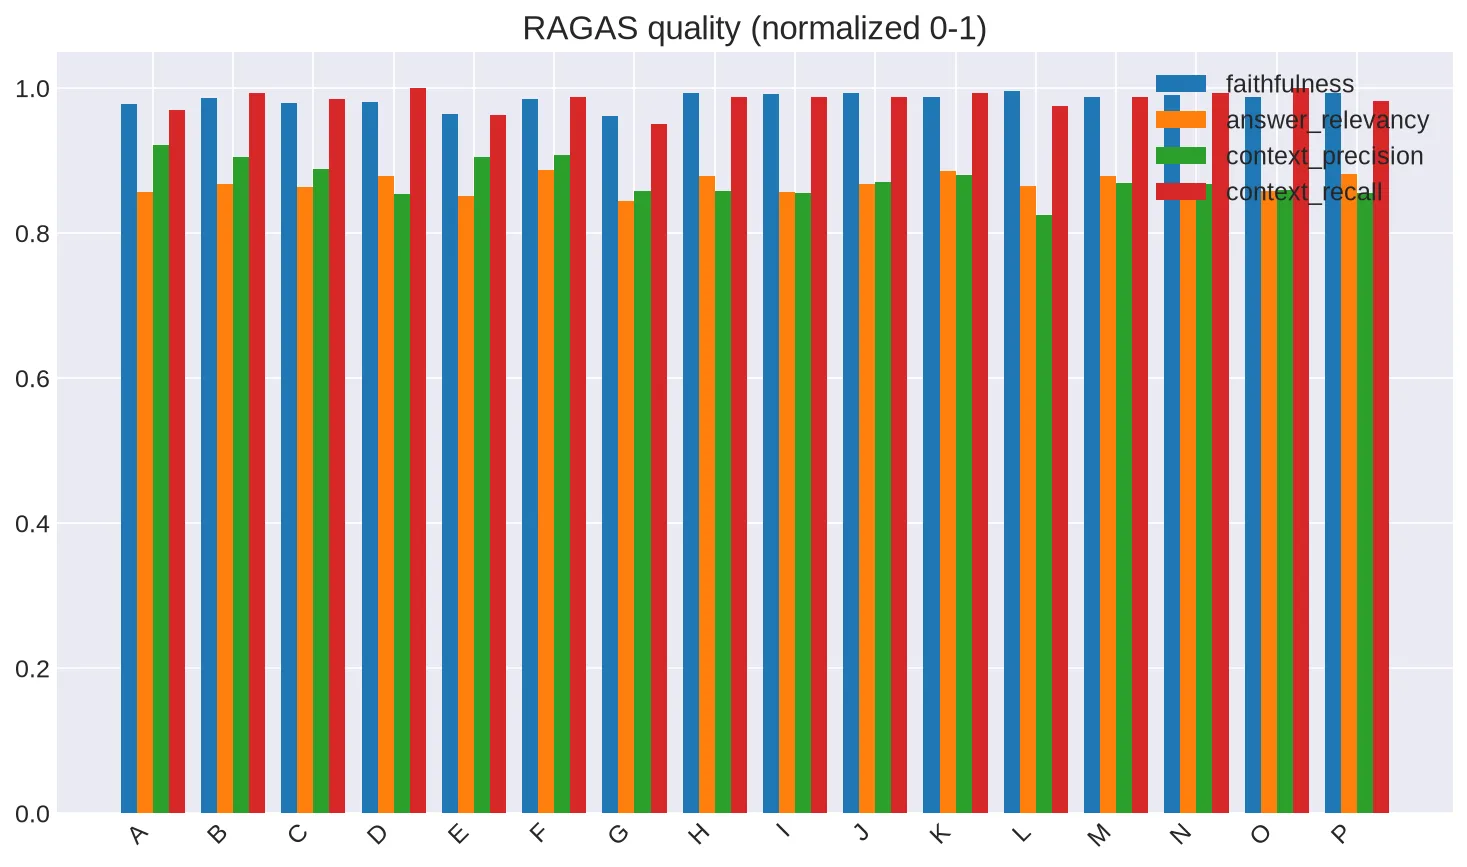
What did hold up across all three runs was the reranker's effect on quality: claim-support +0.044, context precision +0.027, against a small faithfulness dip of −0.012. The reranker earns its place in the architecture — just not for the reason, or anywhere near the magnitude, I originally described. The lesson generalizes beyond this one component: the more dramatic a single-run result looks, the more it deserves a replication before it becomes a design decision.
2. More query expansion was still not better
I expected additional query formulations to improve retrieval coverage. The pooled data confirmed the original finding, at different magnitudes.
| Expansion | Average latency (pooled) |
|---|---|
| Off | 7,883 ms |
| HyDE | 9,483 ms |
| Multi-query | 11,728 ms |
| Both | 11,865 ms |
Expansion turned out to be the single largest latency lever in the entire system — an effect size of 3,982 ms, more than four times the reranker's 949 ms. In the single-run data, the reranker looked like the dominant lever; pooled across three runs, expansion is. HyDE still offered the strongest retrieval-quality trade-off (context precision 0.888, context recall 0.991 — both best-in-class). Multi-query and combining both strategies still added latency without a corresponding precision or recall gain.
I assumed more query variants → more retrieved evidence → better answers. Both the single run and the pooled data said otherwise: more query variants → more retrieval work, unless the additional queries actually produce better evidence — which, here, they didn't. I wouldn't treat retrieval techniques as additive improvements; their value depends on what the rest of the pipeline is already doing.
3. Three generators still barely justified their cost
The gap between one and three generators, already small in the single run, nearly vanished under pooling. Latency was 10,154 ms with one generator vs. 10,325 ms with three — within noise of each other. Every quality effect size for generator count was ≤0.015. The winning configuration still used one generator.
With a reliable reranker doing the retrieval-quality work, three independent generations and a consensus stage bought almost nothing.
4. My grounding metric was still broken — more clearly now
This was the most important failure in the single-run experiment, and pooling only sharpened it. 1,019 of 1,296 answers — 79% — received the worst possible score of 1. The mean was 1.42/5. The Spearman correlation with RAGAS faithfulness stayed essentially at zero: ρ = 0.061, and ρ = −0.164 against context precision — slightly negative. Correlation against every other quality metric stayed at or below 0.10.
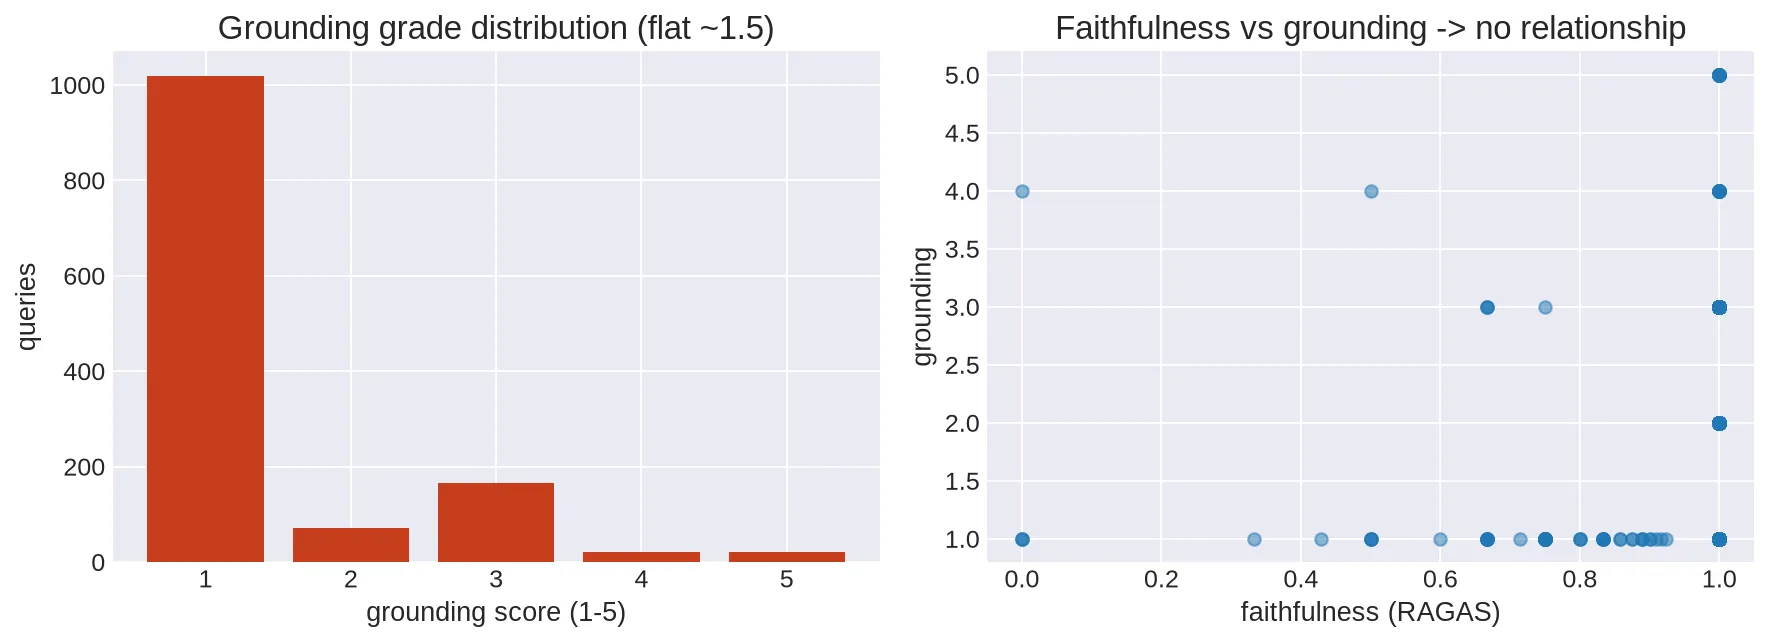
The same parser bug identified in the first pass: a raw digit regex was extracting digits from larger numbers, while arbitrary-format failures were coerced to the worst score.
A metric can look sophisticated and still be useless. I had a custom judge, a numerical score, a seemingly objective measurement — but the pipeline underneath it was broken, and stayed broken across all three runs because nothing was checking its output against ground truth. I excluded grounding from the ranking. That wasn't a failure of the benchmark. Finding the broken metric was one of the results.
5. The pipeline's hallucination-risk label still disagreed with the quality metrics
I tracked a LOW / MEDIUM / HIGH hallucination-risk label produced by the pipeline, expecting configs with better factual quality to show lower risk. Pooling confirmed this was systematically backwards, not a one-run fluke.
Configuration F — the eventual winner — logged 43 LOW, 18 MEDIUM, 20 HIGH across 81 pooled evaluations.
Every reranker-ON configuration (A–H) carried 20–27 HIGH flags, while every reranker-OFF configuration (I–P) carried only 1–3 HIGH — yet the ON configurations also showed higher pooled claim-support (0.562 vs. 0.518). The pipeline's own risk heuristic moves in the opposite direction of the factual-quality metrics it's supposed to approximate.
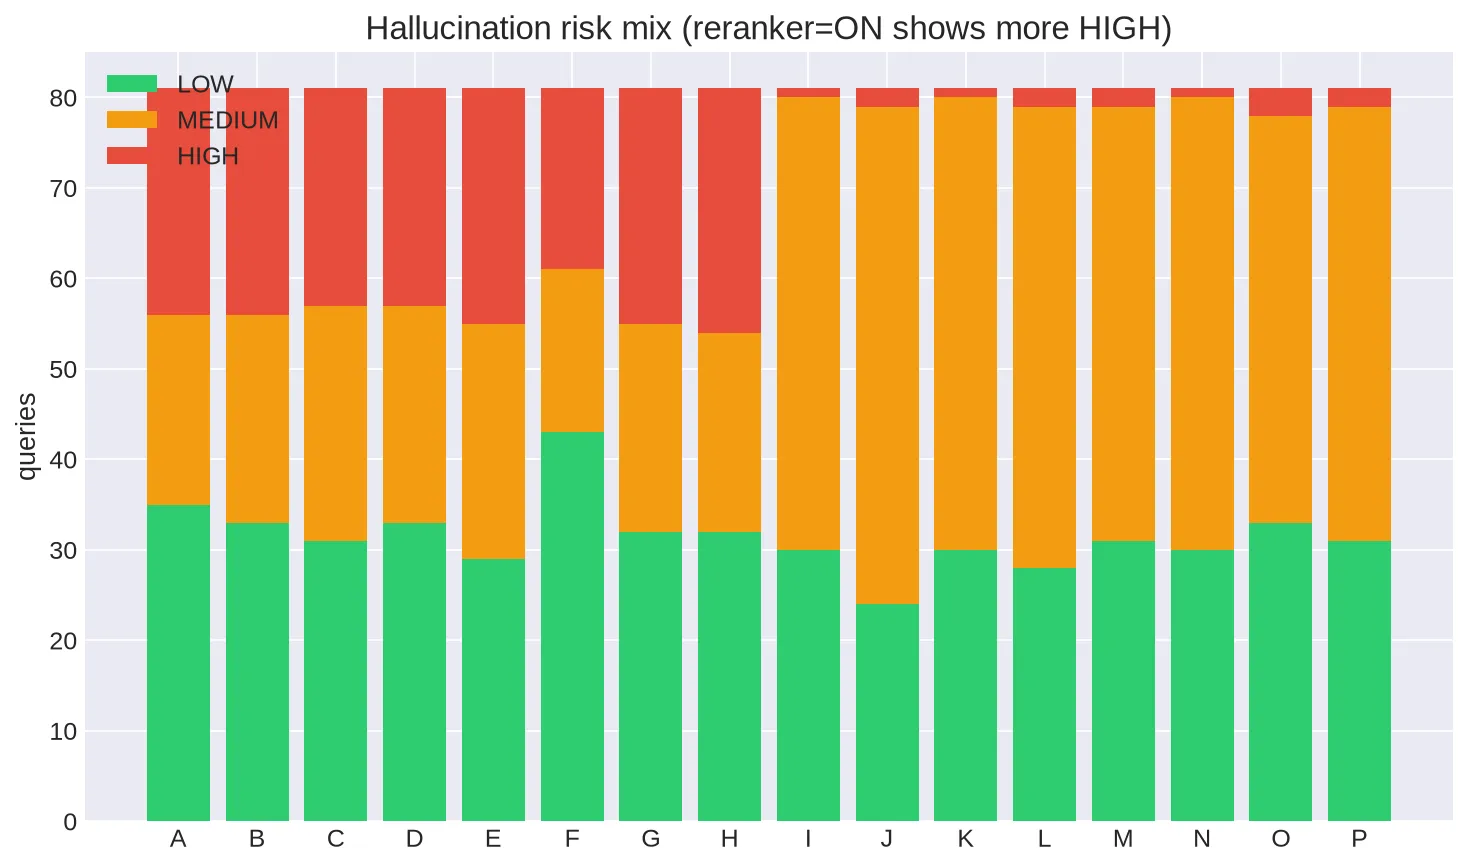
This wasn't a one-run coincidence. It's a reliable disagreement, which makes it a reliable reason not to use that label for model selection.
6. Pooling reduced the noise. It didn't remove it.
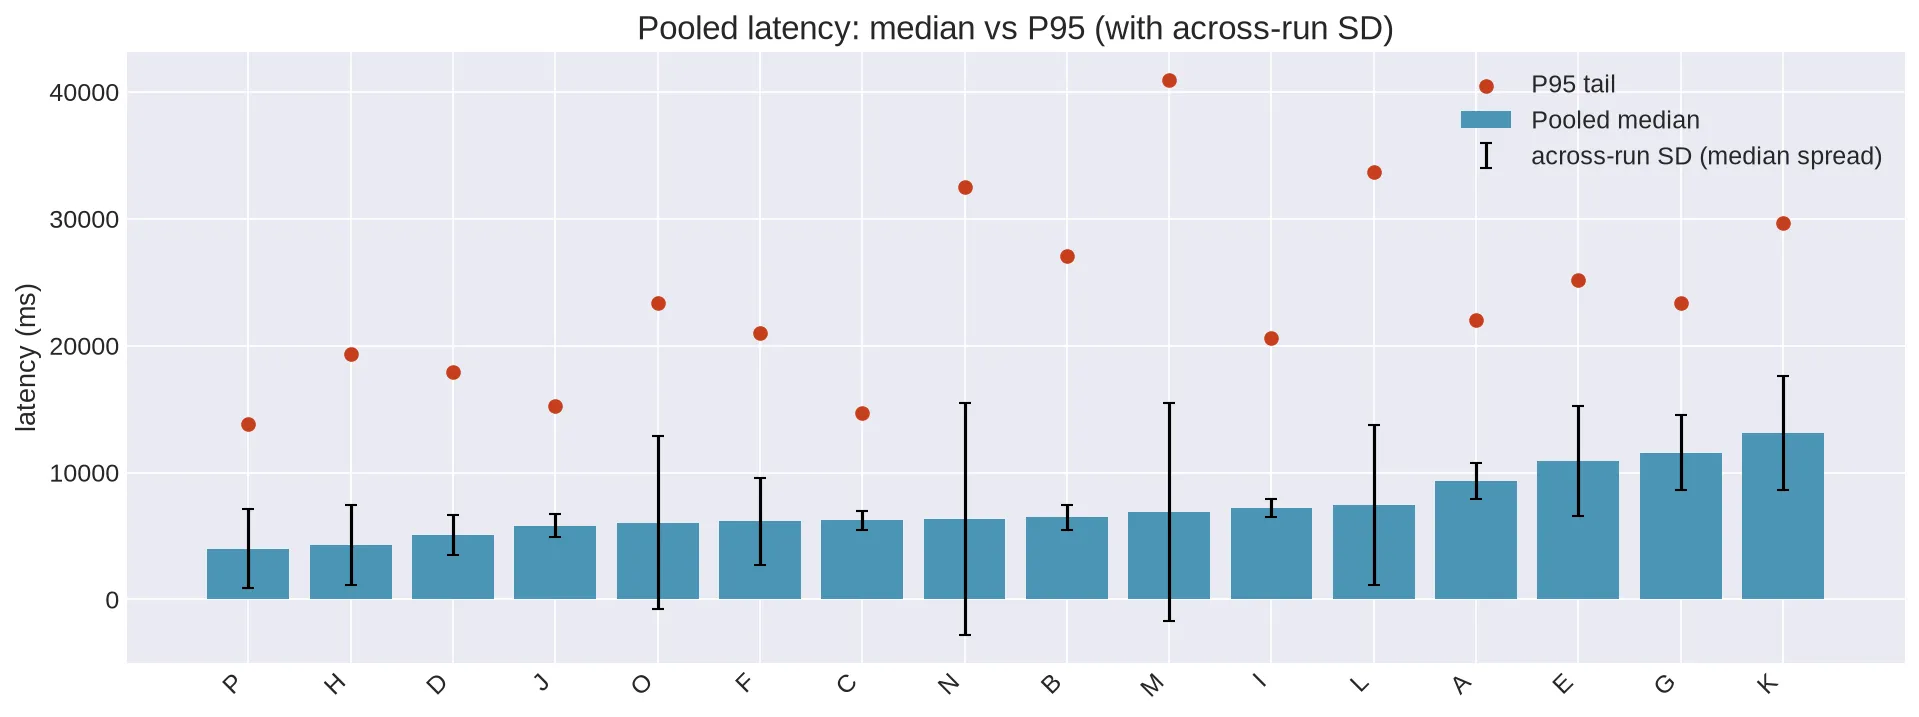
Across the three runs, 7 of the 16 configurations — F, H, L, M, N, O, and P — have an across-run spread (SD of per-run medians) greater than 50% of their pooled median. Their pooled latency figures are directionally useful, not precise.
The uncomfortable part: F, the balanced winner, is one of them — its spread-to-median ratio is 0.562. So is P, the nominal fastest configuration, at 0.777. Configuration D is the fastest configuration that actually passes the gate, at 0.313. Three runs cut the noise a lot. It didn't make every number trustworthy.
Which configuration actually won?
After measuring the individual effects, I ranked all 16 configurations using a balanced objective: 50% latency, 50% quality.
| Rank | Configuration | Composite |
|---|---|---|
| 1 | F — Reranker ON · 1 generator · HyDE | 0.882 |
| 2 | P — Reranker OFF · 1 generator · Off | 0.689 |
| 3 | D — Reranker ON · 3 generators · Off | 0.674 |
| 4 | H — Reranker ON · 1 generator · Off | 0.672 |
| 5 | B — Reranker ON · 3 generators · HyDE | 0.630 |
| 6 | C — Reranker ON · 3 generators · Multi-query | 0.616 |
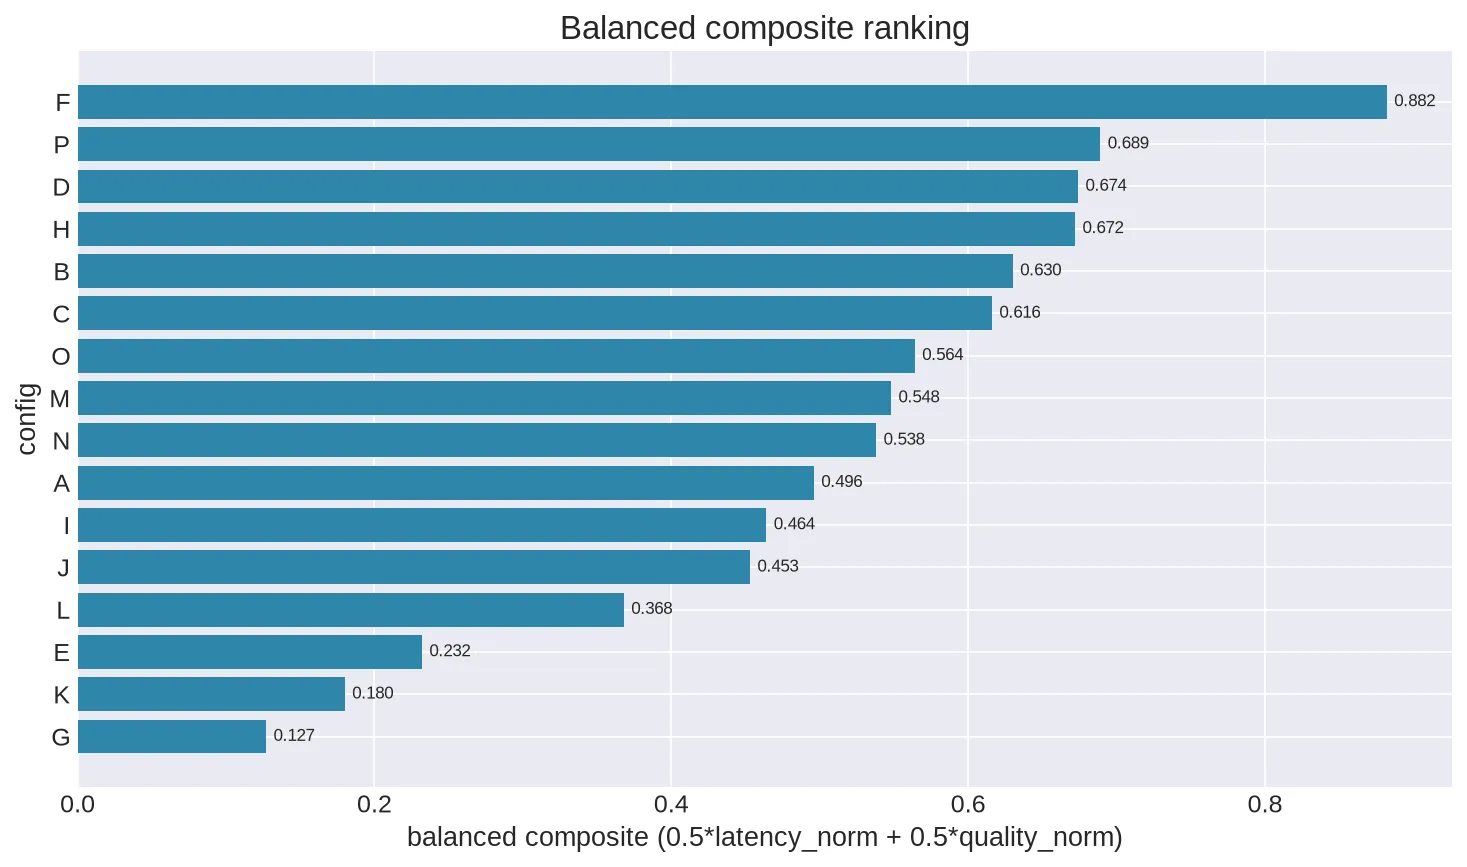
Before trusting that ranking, it's worth checking the raw RAGAS quality metrics the composite is actually built from:
The result wasn't simply 'F has the highest score' — I also checked the speed vs. quality Pareto frontier.
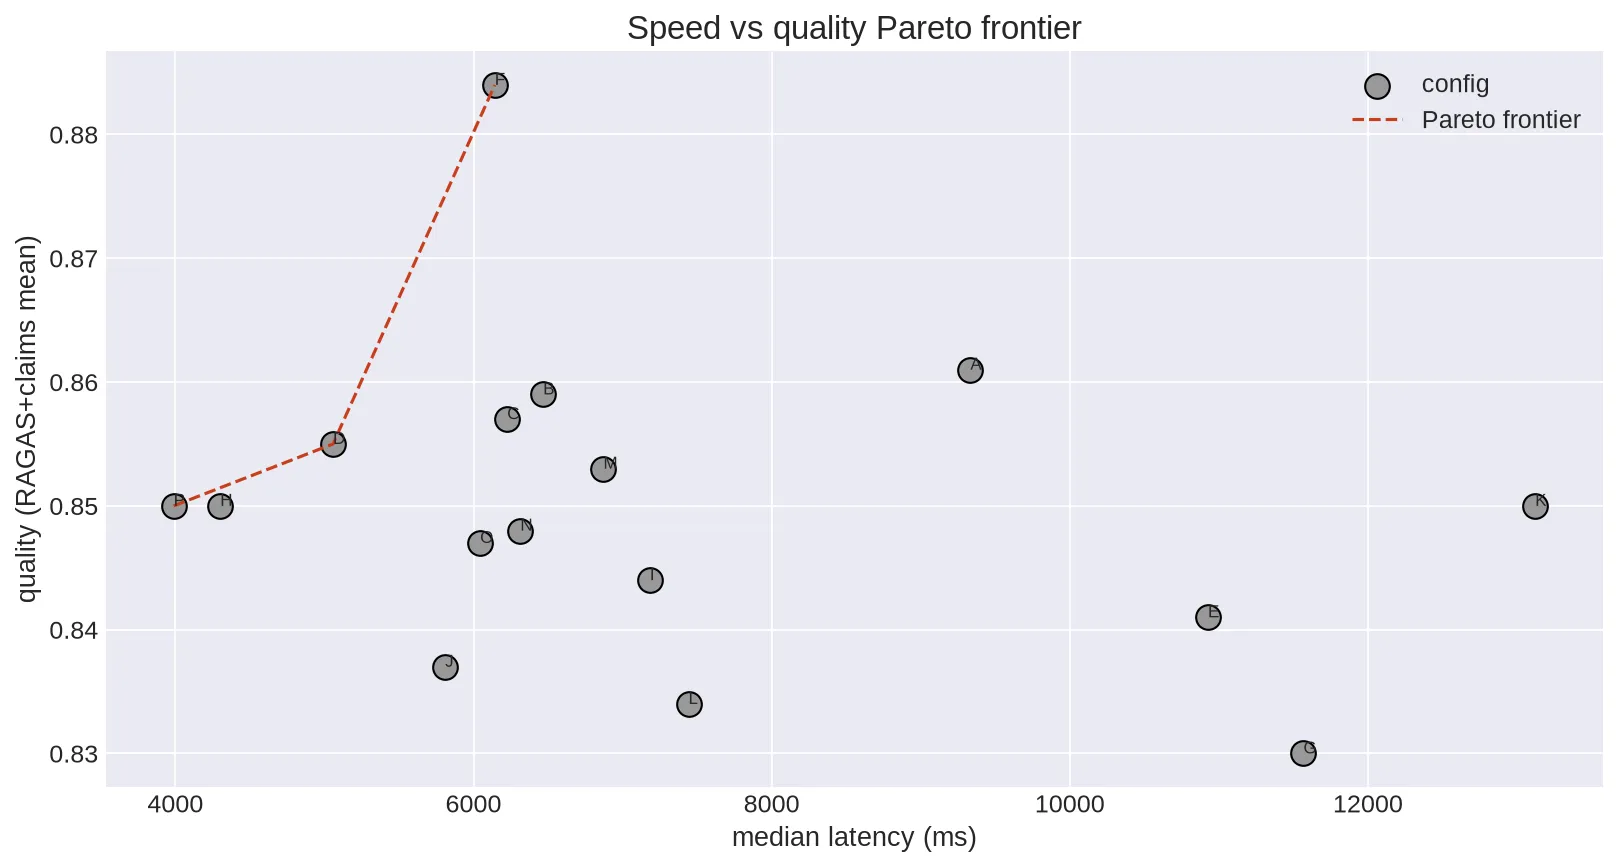
F remained the winner across three of four latency/quality weightings, only losing to P when the objective became heavily latency-dominated. That gave me more confidence the recommendation wasn't just an artifact of a 50/50 weighting.
The final decision
The configuration I would ship: Reranker ON + 1 generator + HyDE — with a caveat the pooled data forces me to make explicit.
| Criterion | Configuration | Result |
|---|---|---|
| Fastest (nominal) | P — OFF · 1 · off | 3,989 ms median — fails noise gate |
| Fastest (stable) | D — ON · 3 · off | 5,057 ms median — passes noise gate |
| Highest quality | F — ON · 1 · HyDE | 0.884 quality |
| Balanced | F — ON · 1 · HyDE | 0.882 composite |
F's own latency figure is one of the seven that fails the noise gate. If a fully stable number is a hard requirement, B (ON · 3 · HyDE) is the closest quality-comparable alternative that isn't flagged. The winning system is still smaller than the one I originally built — that result held. The reasons underneath it changed.
Explanation
The original architecture was based on a reasonable intuition: if one technique helps, several should help more. The single run seemed to confirm it, and even seemed to explain why — a better reranker reduces the context reaching the generator, so the system gets faster despite adding a stage.
The pooled data forced a real revision — not to the architecture, but to my own first read of the evidence. The reranker's dramatic single-run speedup didn't survive replication; it settled to 9% instead of 45%. That doesn't mean the first run was invalid or the reasoning was careless. It means one run of a system whose latency is dominated by external API variance isn't enough evidence to justify a design decision, however plausible the mechanism sounds.
What did survive, consistently, across both the single run and the pooled replication: the reranker's value is in quality, not speed. Query expansion strategies interact rather than stack — HyDE alone beats HyDE-plus-multi-query — and expansion turned out to be the largest latency lever in the entire system, larger than I'd credited it with the first time around. Extra generators add little once retrieval quality is already good.
The custom grounding metric and the pipeline's hallucination-risk label were both wrong in the single run, and pooling made both failures clearer rather than resolving them. A benchmark can produce a precise-looking ranking while the measurements underneath it are unreliable — whether you run it once or three times. Replication doesn't fix a broken metric; it just gives you more confidence about which effects are real and which ones were never there.
What I'd do differently
I would build the measurement harness before adding the fourth technique, and I would replicate before trusting any large effect. I already knew, in principle, that single measurements carry risk — this project gave me a concrete example of what that risk looks like: a 45% effect, with a plausible causal story attached, that mostly wasn't there. If I repeated the project, I'd change the order:
- Define the engineering question.
- Build the evaluation harness.
- Validate every metric on manually inspected examples.
- Establish a simple baseline.
- Add one architectural lever at a time.
- Run the factorial benchmark once the measurement pipeline is trustworthy — and replicate before trusting any effect large enough to justify a design decision on its own.
- Use the replicated, pooled benchmark to decide what belongs in the production architecture.
I'd also add automated tests around every custom evaluator and parser before using its output in model selection. The grounding metric was the clearest example — a sophisticated judge undone by a small parsing bug, one that stayed broken across all three runs because nothing was checking its output against ground truth.
Measurement is part of the system. And replication is part of measurement — a result that only appears once isn't yet a result, it's a hypothesis about a hypothesis. The broader lesson is simpler still: I don't want to build the most sophisticated RAG system I can. I want to know which complexity earns its place.